DevCon2025 Jetstream VM Instructions
Last updated on 2025-05-23 | Edit this page
Running NGIAB on Jetstream VM for DevCon2025
Before continuing, you will need the SSH credentials for your instance. These have been emailed to you.
Setting up an SSH session with SSH tunneling
Input the following command into your Unix terminal or Windows command prompt:
e.g.:
The -L flag is used to initiate SSH tunneling, which is necessary to view the NGIAB visualizer.
Your selected port in the above command will differ depending on how you’d prefer to connect to the visualizer.
-
[Recommended] To open the visualizer via a Virtual
Network Computing (VNC) client, use port
5906. - To open the visualizer directly in your web browser, use a port such
as
80or8080.- You may receive a message such as “Could not request local forwarding.” If this happens, you will need to select a different port.
When logging in for the first time, you may be asked whether you’d like to trust the host. Type ‘yes’ to do so.
After that, simply type in your password to gain access to your instance’s terminal.
Task 1: Running NGIAB With Prepared Data
-
Run the following command to preprocess data:
BASH
uvx --from ngiab_data_preprocess cli -i gage-10154200 -sfr --start 2017-09-01 --end 2018-09-01 --source aorcUse the default output folder given.
-
Run the following commands to clone the NGIAB-CloudInfra repo and run guide script:
When prompted, enter the following input data directory path:
/home/exouser/ngiab_preprocess_output/gage-10154200 - When prompted about which Docker image to use, select Option 1 (use existing Docker image).
- When prompted about which run option to use, select Option 2 (run NextGen in parallel mode).
- When prompted to redirect command output to
/dev/null, select no. This allows you to see details about your NextGen run. - After the NextGen run is complete, you will be asked “Would you like to continue?”. Select Option 2 (exit), which will allow you to progress to the TEEHR evaluation.
- Run the TEEHR evaluation when prompted. When given the option to
select an image tag, choose
x86, and choose option 1 (use existing TEEHR image). - After the TEEHR evaluation is complete, run the Tethys visualizer
when prompted. When asked about the image, choose the default latest
image. Note: the visualizer may take a while to load. When asked which
port to use, use the default port (80).
- If you are opening the visualizer in a VNC client, first connect to
localhost:5906using the password emailed to you. Then, open the link provided by the console output in the remote desktop’s web browser. - If you are opening the visualizer in your local web browser, simply enter the link provided by the console output.
- If you are opening the visualizer in a VNC client, first connect to
- Enter
Ctrl+Cin the terminal to stop the visualizer when you are done.
Task 2: Running NGIAB with Your Own Data
-
Use the Data Preprocess tool’s graphical user interface (map app) to select your favorite catchments and time period that you would like to perform a NextGen run on. To be able to use TEEHR, you must select a region that contains USGS gages. You can show or hide USGS gages in the map app by toggling the “Show/Hide gages” button in the upper left.
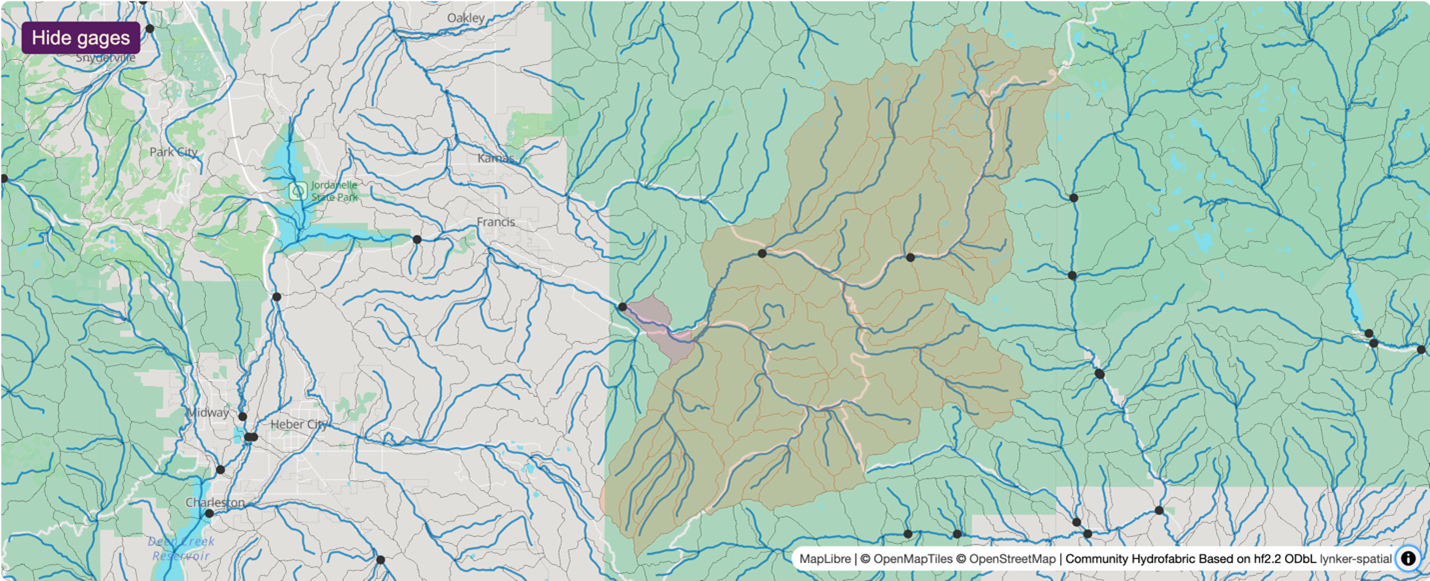 Figure 1: Example view from the Data Preprocess tool. The highlighted region (light orange area; downstream-most basin in pink) represents the specific study basin, illustrating the river network (blue lines), sub-basins (orange), and surrounding USGS gaging stations (black dots).
To view the map app in your VNC viewer or your local web browser, use one of the IP addresses listed after the map app is started.
Copy the given command. Exit out of the Data Preprocess tool in the terminal using
Ctrl+Cand run the copied command to preprocess data. If you include the--runtag, the Data Preprocessor will automatically execute a NextGen run.If you included the
--runtag, you will need to run therunTeehr.shandviewOnTethys.shscripts separately in order to use TEEHR and the Data Visualizer.
When you run viewOnTethys.sh, make sure to select a
different port (we like 8081). Use your VNC viewer to access the
visualization at the given link.
If you did not include the --run tag, you can run
guide.sh as described in Task 1.
- Experiment with different basins or options as much as you’d like!